
Summary
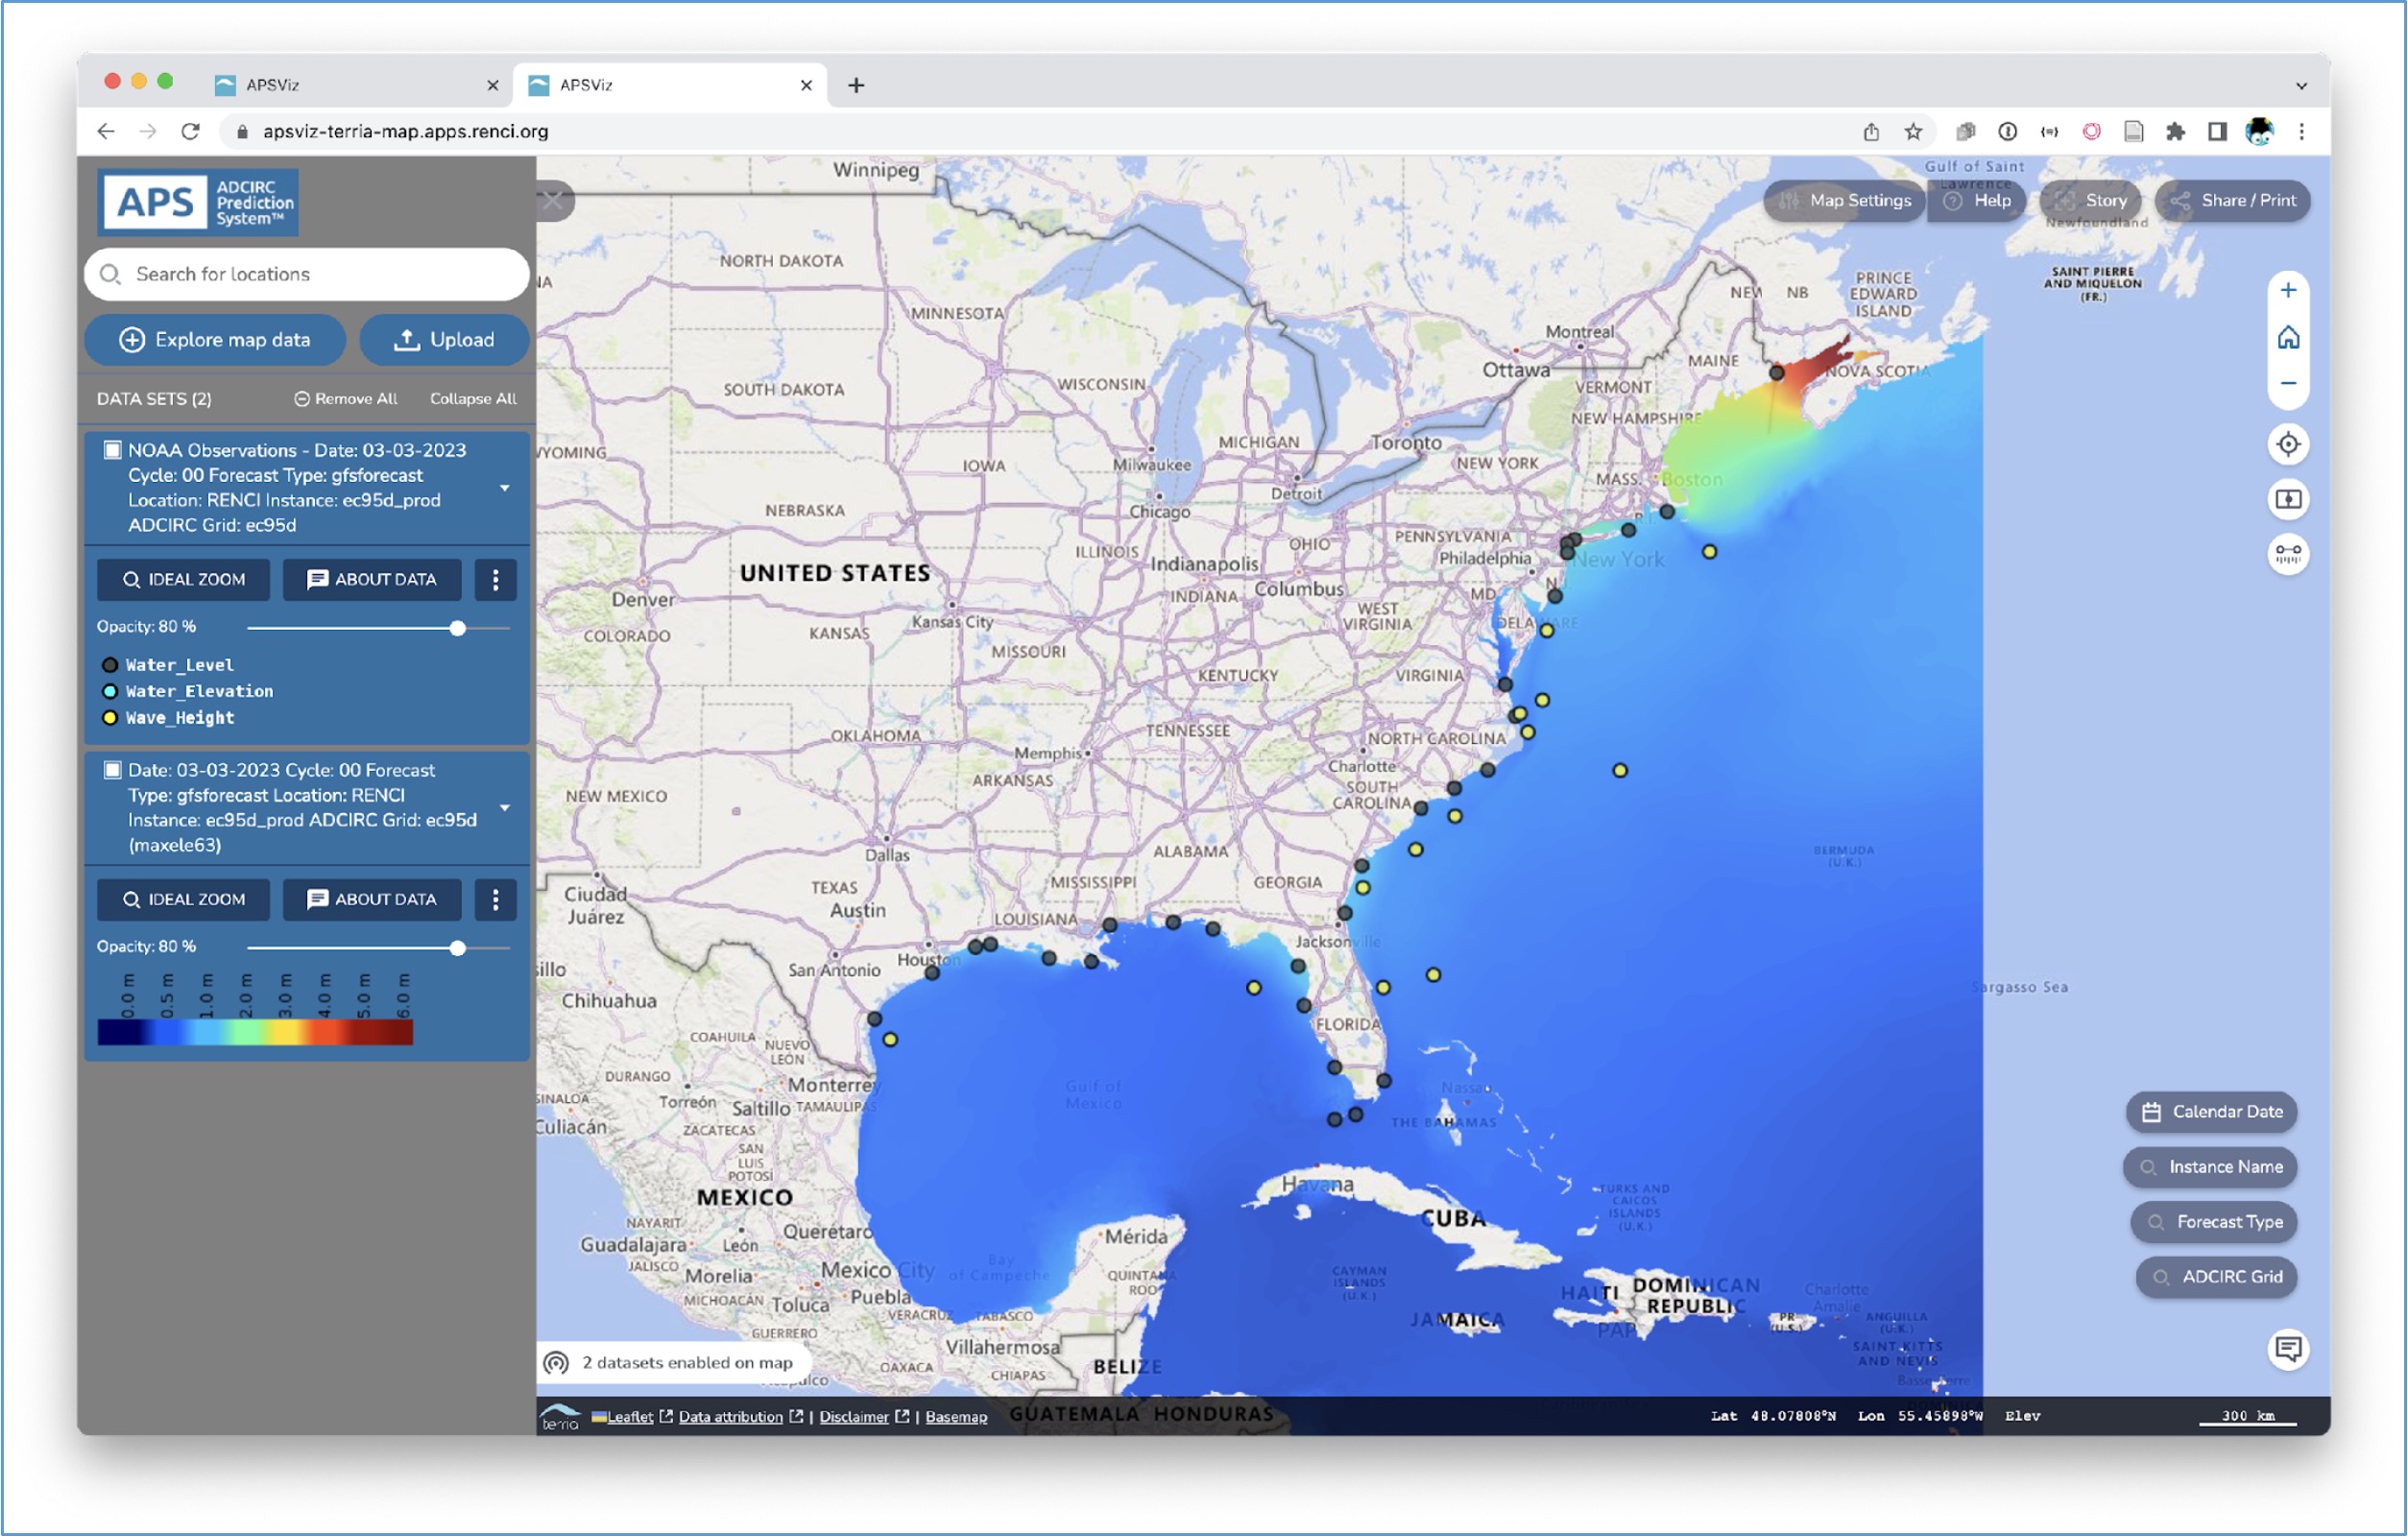
The APSViz system is an advanced web-map and cloud-based visualization system for the ADCIRC Prediction System that leverages the existing messaging apparatus and an open-source mapping framework called TerriaJS. It is now hosted in Amazon Web Services (AWS) and uses AWS Elastic Kubernetes Services (EKS) to automatically scale up resources as demand on the website increases. This current “Year 9” version of APSViz has matured to the point where the features described in prior workplans have been fully implemented (e.g., display of maximum water levels, charting of timeseries of observed and predicted water levels, user-specified color map ranges, addition of the downscaled Kalpana layers).
During Year 10, we will maintain both the AWS production system and the development system at RENCI. Additionally, two new features for APSViz are planned for Year 10. We will first add time-dependent layers for the water level, wind speed, and significant wave heights. [In the “Year 9” APSViz version, only the maximum of the predicted water levels, winds, and wave heights are available for visualization.] We will also add the ability to select (by mouse click) a location on the displayed map and have the predicted timeseries displayed as a chart. This feature complements the current feature that displays predicted and observed data at pre-defined locations such as NOAA water level gages or wave buoys.
Investigators

University of North Carolina at Chapel Hill
Other Research Participants/Partners
- Lisa Stillwell (Lead Software Developer, RENCI)
- Phil Owen (Software engineer, RENCI)
- Jim McManus (Geospatial software, RENCI)
- Jeff Tilson (RENCI)